Analytical selection
The model identifies the sensing resistance that maximizes compute SNR for each evaluated device and N.
Accuracy evidence
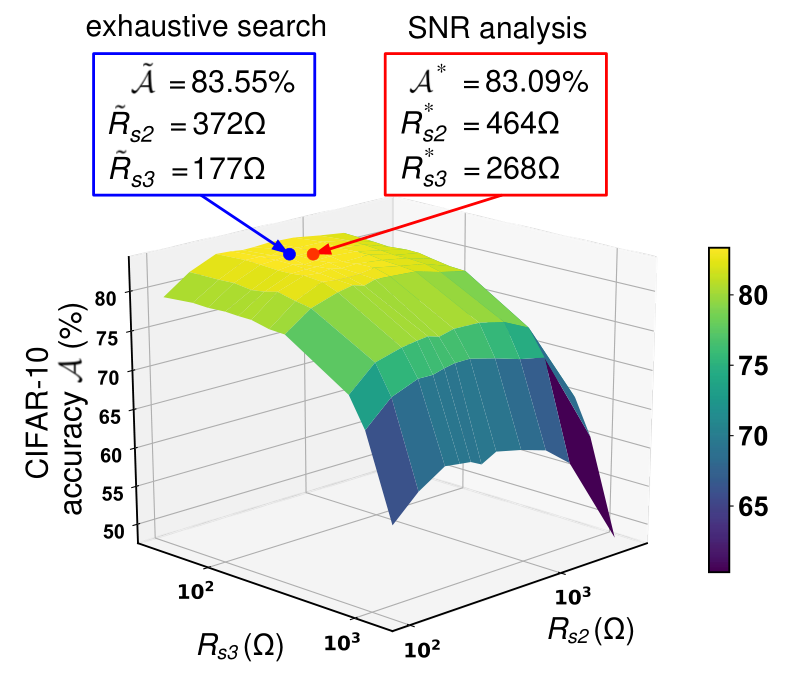
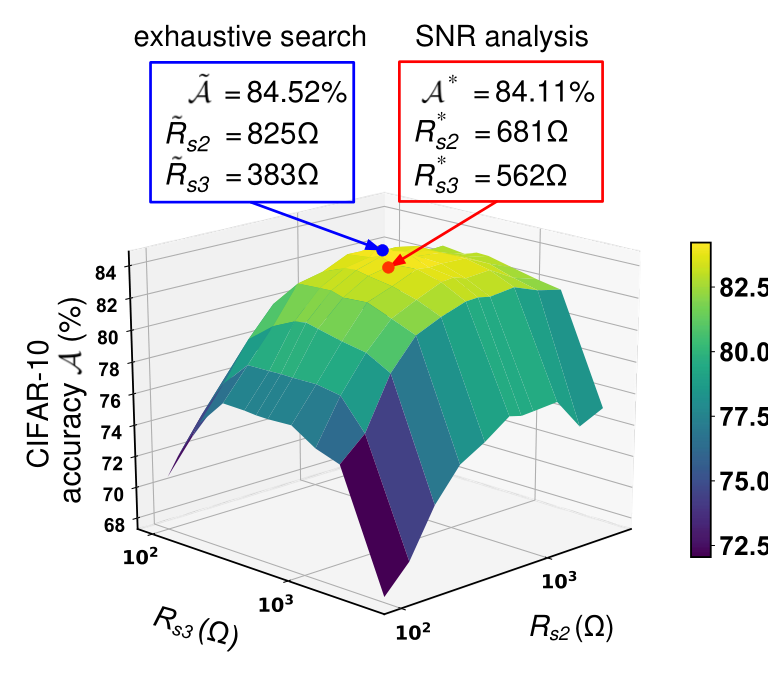
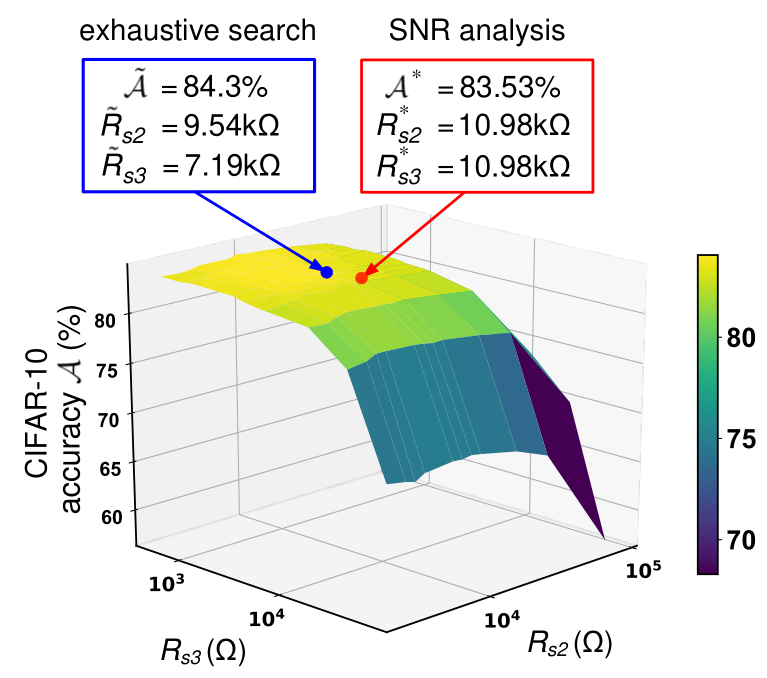
The device-specific circuit coordinates are compared with an exhaustive parameter search after mapping ResNet-20 across the evaluated MRAM, ReRAM, and FeFET crossbars.
| Device | Exhaustive maximum | SNR-selected | Gap |
|---|---|---|---|
| MRAM | 83.55% | 83.09% | 0.46 pp |
| ReRAM | 84.52% | 84.11% | 0.41 pp |
| FeFET | 84.30% | 83.53% | 0.77 pp |
Fixed-point baseline: 84.94%. The mapped experiment used signed 5-bit inputs, ternary weights, and no retraining.
Network mapping
The three residual blocks implement dot products of dimension N = 144, 288, and 576, and each block maps to a crossbar with its own sensing resistance. Rs1 is held at its optimum while (Rs2, Rs3) are swept. The SNR analysis picks its point without simulating the network.
Accuracy surfaces
Blue marks the exhaustive maximum. Red marks the SNR-selected point.
Evidence chain
Maximizing array-level compute SNR also maximizes network accuracy, so each bank’s sensing resistance can come from the model instead of a simulation-based search.
The model identifies the sensing resistance that maximizes compute SNR for each evaluated device and N.
In the paper’s specific ReRAM validation case, the behavioral SNR trend follows the precomputed SPICE result.
The selected device-specific points closely match the best mapped ResNet-20 accuracies.
The architect applies these sensing points to a workload partitioned across crossbar banks.
Open the architect